Poster
# 24

Main Page

6th Internet World Congress for Biomedical Sciences

IndexIndex
Multi-page version
Dynamic pages

Quantitative changes in neuronal population during aging and contralateral lesions.

María Jesús Ramírez-Expósito(1), José Manuel Martínez-Martos(2)
(1)Unit of Physiology. University of Jaen - Jaén. Spain
(2)Unit of Physiology. University of Jaén - Jaén. Spain

[ABSTRACT] [INTRODUCTION] [MATERIAL & METHODS] [RESULTS] [IMAGES] [DISCUSSION] [BIBLIOGRAPHY] [Discussion Board]
RESULTS Previous: Differential effects of exogenous oleic and linoleic fatty acids and cholesterol on aminopeptidase activities in rat astrocytes in primary culture. Previous: Differential effects of exogenous oleic and linoleic fatty acids and cholesterol on aminopeptidase activities in rat astrocytes in primary culture. Previous: Differential effects of exogenous oleic and linoleic fatty acids and cholesterol on aminopeptidase activities in rat astrocytes in primary culture. DISCUSSION
[Cell Biology & Cytology]
Next: Quantitative changes in glial population during aging and contralateral lesions.
[Neuroscience]
Next: Quantitative changes in glial population during aging and contralateral lesions.
[Physiology]
Next: Quantitative changes in glial population during aging and contralateral lesions.

IMAGES

fig. 1
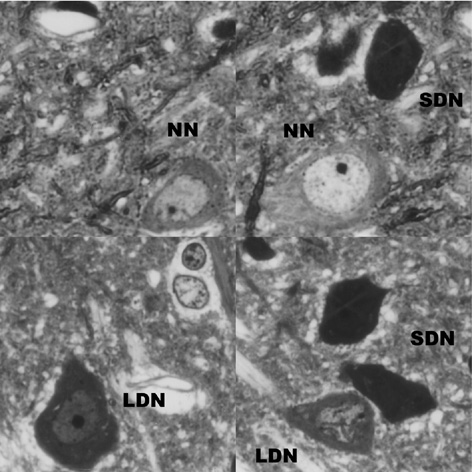
Figure 1. Light microscopy image of toluidine blue stained semithin sections of the frontal cortex of lesioned animals showing normal neurons (NN), light dark neurons (LDN) and strong dark neurons (SDN).


fig. 2
Figure 2. Neuronal density (Mean±SEM) expressed as the number of normal, light dark, strong dark and total neurons per 106 µm3 of tissue, in the different cortical layers of control and lesioned groups (**p<0.001).


fig. 3
Figure 3. Neuronal soma, nucleus, and nucleolus area (Mean±SEM) expressed in µm2 of normal neurons (NN), light dark neurons (LDN), strong dark neurons (SDN) and total neuron (TN) in the frontal cortex of control and lesioned animals (**p<0.001).


fig. 4
Figure 4. Neuronal soma and nucleus form index (Mean±SEM) of normal neurons (NN), light dark neurons (LDN), strong dark neurons (SDN) and total neuron (TN) in the frontal cortex of control and lesioned animals. Form index is an adimensional parameter.


Discussion Board
Discussion Board

Any Comment to this presentation?

[ABSTRACT] [INTRODUCTION] [MATERIAL & METHODS] [RESULTS] [IMAGES] [DISCUSSION] [BIBLIOGRAPHY] [Discussion Board]

RESULTS Previous: Differential effects of exogenous oleic and linoleic fatty acids and cholesterol on aminopeptidase activities in rat astrocytes in primary culture. Previous: Differential effects of exogenous oleic and linoleic fatty acids and cholesterol on aminopeptidase activities in rat astrocytes in primary culture. Previous: Differential effects of exogenous oleic and linoleic fatty acids and cholesterol on aminopeptidase activities in rat astrocytes in primary culture. DISCUSSION
[Cell Biology & Cytology]
Next: Quantitative changes in glial population during aging and contralateral lesions.
[Neuroscience]
Next: Quantitative changes in glial population during aging and contralateral lesions.
[Physiology]
Next: Quantitative changes in glial population during aging and contralateral lesions.
María Jesús Ramírez-Expósito, José Manuel Martínez-Martos
Copyright © 1999-2000. All rights reserved.
Last update: 10/01/00