Poster
# 19
![]()
Poster |
|
6th Internet World Congress for Biomedical Sciences |
María Dolores Mayas-Torres(1), José Manuel Martínez-Martos(2), María Jesús Ramírez-Expósito(3), María Jesús García-López(4), Isabel Prieto-Gómez(5), Garbiñe Arechaga-Maza(6), Manuel Ramírez-Sánchez(7)
(1)(2)(4)(5)(6)(7)Unit of Physiology. University of Jaén - Jaén. Spain
(3)Unit of Physiology. University of Jaen - Jaén. Spain
|
|
|
|
|
|
[Neuroscience] |
[Physiology] |
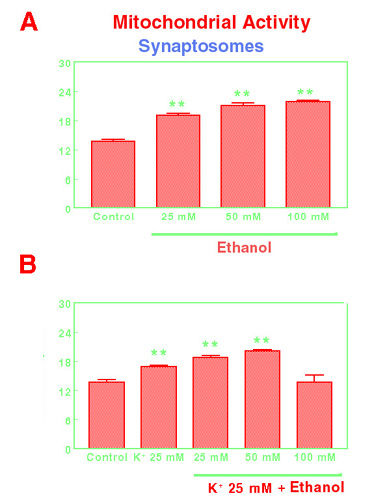 |
| Figure 1. Effects of ethanol 25 mM, 50 mM and 100 mM on basal mitochondrial activity in mouse frontal cortex synaptosomes (A) or after the stimulation with K+ 25 mM (B). Results are exprssed in optical density units (Mean±SEM; n=11; **p<0.01). |
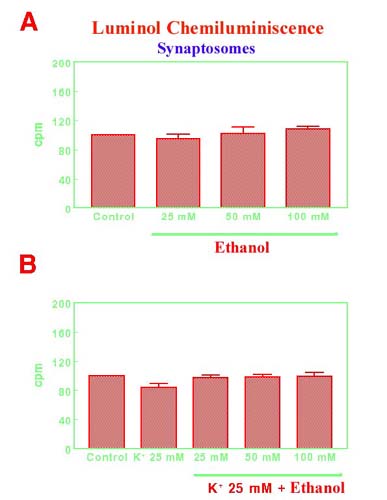 |
| Figure 2. Effects of ethanol 25 mM, 50 mM and 100 mM on basal free radical generation in mouse frontal cortex synaptosomes (A) or after the stimulation with K+ 25 mM (B), using luminol as enhancer of the chemiluminescence signal. Results are expressed in counts per minute (cpm) as percent vs. control levels (Mean±SEM; n=11). |
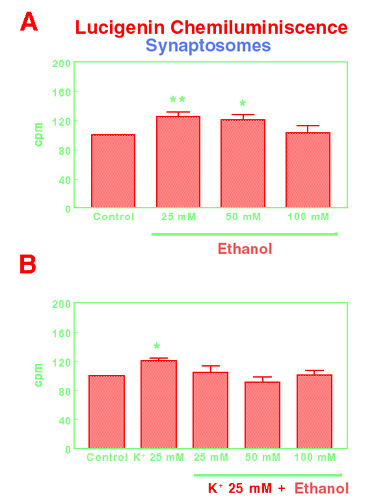 |
| Figure 3. Effects of ethanol 25 mM, 50 mM and 100 mM on basal free radical generation in mouse frontal cortex synaptosomes (A) or after the stimulation with K+ 25 mM (B), using lucigenin as enhancer of chemiluminescence signal. Results are expressed in counts per minute (cpm) as percent vs. control levels (Mean±SEM; n=11; *p<0.05; **p<0.01). |
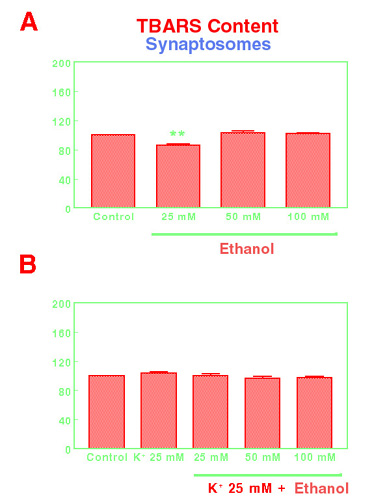 |
| Figura 4. Effects of ethanol 25 mM, 50 mM and 100 mM on basal TBARS content in mouse frontal cortes synaptosomes (A) or after the stimulation with K+ 25 mM (B). Results are expressed as described in material and methods, as percent vs. control levels (Mean±SEM; n=11; **p<0.05). |
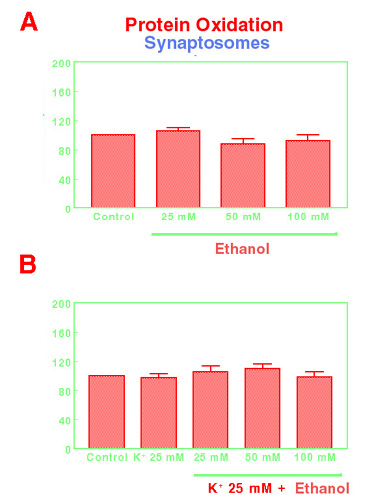 |
| Figure 5. Effects of ethanol 25 mM, 50 mM and 100 mM on basal protein oxidation in mouse frontal cortex synaptosomes (A) or after the stimulation with K+ 25 mM (B). Results are expressed as described in material and methods (Mean±SEM; n=11). |
|
|
|
|
|
|
[Neuroscience] |
[Physiology] |