 MAP-2-immunostained sections in the hippocampus
4 days after the injection.
MAP-2-immunostained sections in the hippocampus
4 days after the injection.Effect of A1 adenosine receptor antagonist
for:
--Neuronal Cells.
--Glial Cells.
--Neuronal Apoptosis.
<Top Page> <Introduction> <Methods> <Discussion> <Conclusion> <References>
Effect of A1 adenosine receptor ANTAGONIST
against KA-induced neurodegeneration
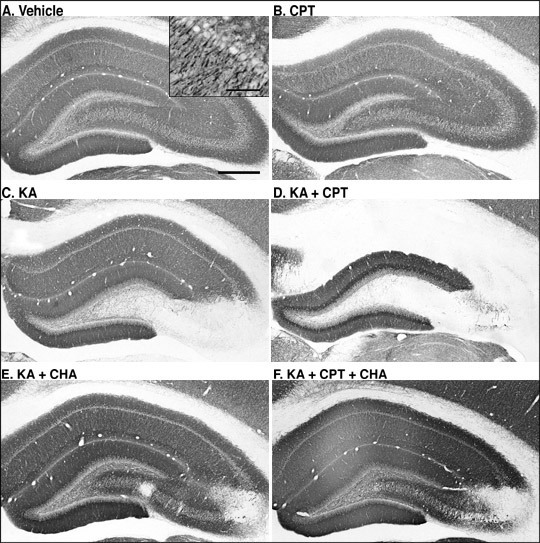
MAP-2-immunoreactivity was widely observed
in vehicle-injected rat hippocampus (Fig.
1A). CPT itself appeared not to have any
effect on MAP-2-immunoreactivity (Fig. 1B).
After the i.c.v. injection of KA, MAP-2-immunoreactivity
was lost specifically in the CA3 (Fig. 1C).
Pretreatment with CPT (10 mg/kg, i.p.), an
A1 adenosine receptor antagonist, at 60 min
before the injection of KA, resulted in a
marked reduction in MAP-2-immunoreactivity
in both CA1 and CA3 (Fig. 1D).
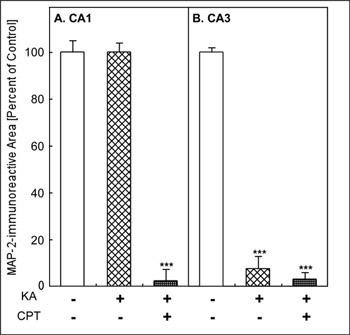
Quantitatively, the MAP-2-immunoreactive
area was significantly decreased only in
the CA3 after the injection of KA alone (Fig.
2B). It did not change in the CA1 (Fig. 2A).
In contrast, the combination of KA and CPT
(KA/CPT), induced a significant loss of MAP-2-immunoreactive
area in the CA1 (Fig. 2).
Effect of A1 adenosine receptor agonist AGONIST
KA-induced neuronal cell loss
The coadministration of CHA, an A1 adenosine
receptor agonist, with KA attenuated the
loss of MAP-2-immunoreactivity in the CA3
induced by KA (Fig. 1E). In addition, the
coadministration of CHA with KA/CPT also
attenuated the neuronal cell loss in both
the CA1 and the CA3 (Fig. 1F).
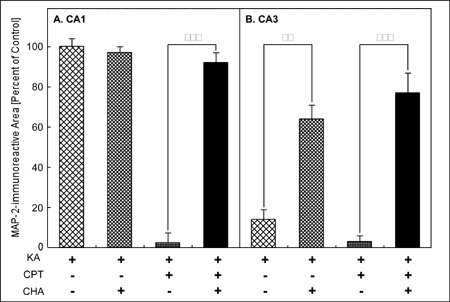
Quantitatively, the loss of the MAP-2-immunoreactive
area in the CA3 with the injection of KA
alone was significantly attenuated by the
administration of CHA (Fig. 3B). The administration
of CHA significantly attenuated the loss
of the MAP-2-immunoreactive area in both
the CA1(Fig. 3A) and the CA3 (Fig. 3B) caused
by the injection of KA/CPT.
**Jump to the Top of Page, Fig. 1, Fig. 2, Fig. 3, Fig. 4, Fig. 5, Fig. 6, Fig. 7
Fig. 1: Effects of an A1 adenosine receptor antagonist
(CPT) and agonist (CHA) on KA-induced neurodegeneration.
MAP-2-immunostained sections in the hippocampus
4 days after the injection.
**Jump to the Top of Page, Fig. 1, Fig. 2, Fig. 3, Fig. 4, Fig. 5, Fig. 6, Fig. 7
Fig. 2: Quantitative analysis of KA-induced neuronal
cell loss and the effect of an A1 adenosine receptor antagonist (CPT)
**Jump to the Top of Page, Fig. 1, Fig. 2, Fig. 3, Fig. 4, Fig. 5, Fig. 6, Fig. 7
Fig. 3: Quantitative analysis of KA- or KA/CPT-induced
neuronal cell loss and the effect of an A1
adenosine receptor agonist (CHA).
**Jump to the Top of Page, Fig. 1, Fig. 2, Fig. 3, Fig. 4, Fig. 5, Fig. 6, Fig. 7
Histological changes of after coadministration
of KA, CPT, and/or CHA
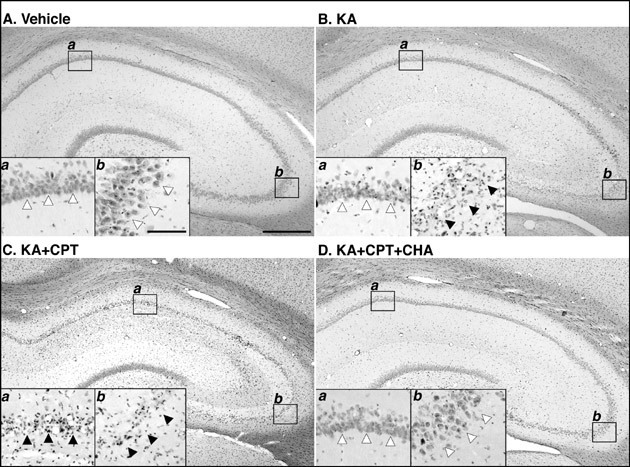
Injection of KA alone induced loss of the
pyramidal neurons in CA3 (Fig. 4Bb), but
not CA1 (Fig. 4Ba), although vehicle appeared
not to have any effect on neurons (Fig. 4A).
Pretreatment of CPT at 60 min before the
injection of KA induced marked loss of neurons
in both CA1 and CA3 (Fig. 4C). The coadministration
of CHA with KA/CPT attenuated the neuronal
cell loss in both the CA1 and the CA3 (Fig.
4D). Therefore, the histological changes,
which examined using H-E staining, were conformity
well with changes of MAP-2-immunoreactivity.
Fig. 4: Histological changes (hematoxylin and eosin staining)of rat hippocampal formation 4 days aftrer
injection of KA and effects of an A1 adenosine
receptor antagonist (CPT) and agonist (CHA)
**Jump to the Top of Page, Fig. 1, Fig. 2, Fig. 3, Fig. 4, Fig. 5, Fig. 6, Fig. 7
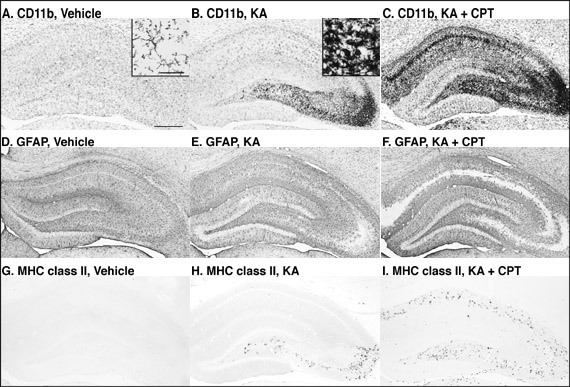
Changes in glial cells after KA-injection
and the effect of adenosine receptor antagonist
Microglia (CD11b-immunostaining) have thin
and longer processes that are typically ramified
(Fig. 4A). Four days after the i.c.v. injection
of KA, numerous microglia with thick and
shorter processes, i.e., typical ameboid
type, were observed in the CA3 (Fig. 4B inset),
while the microglia in the other hippocampal
subfields were mostly ramified (Fig. 4B).
After treatment with KA/CPT, ameboid microglia
with thick and shorter processes were also
observed in the CA1 (Fig. 4C). Astrocytes
(GFAP-immunostaining) were slightly activated
by injection with KA (Figs. 4D-4F). MHC class
II-immunoreactivity was undetectable in the
vehicle-injected rat hippocampus (Fig. 4G).
Four days after KA-injection, MHC class II-immunoreactivity
was observed only in the CA3 (Fig. 4H). Treatment
with KA/CPT also induced MHC class II-immunoreactivity
in the CA1 (Fig. 4I). The regions in which
glial activation occurred correlated well
with those that showed neurodegeneration,
as judged by MAP-2-immunoreactivity.
Fig. 5: Photomicrographs of CD11b-, GFAP-, and MHC
class II-immunostained sections in the hippocampus
4 days after the injection.
**Jump to the Top of Page, Fig. 1, Fig. 2, Fig. 3, Fig. 4, Fig. 5, Fig. 6, Fig. 7
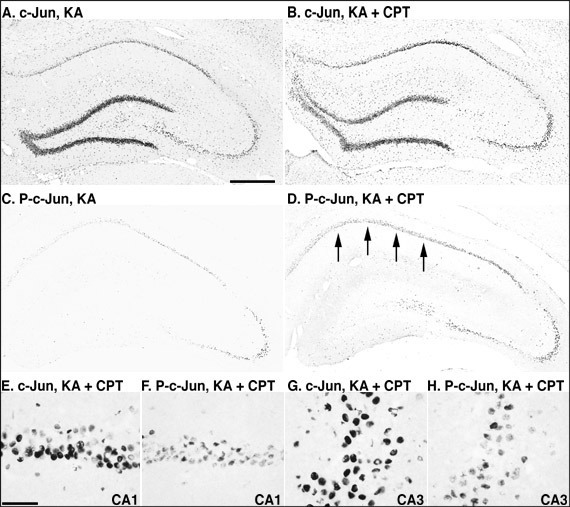
Phosphorylation of c-Jun after KA-injection
and the effects of an adenosine receptor
antagonist and agonist
In the vehicle-injected rat hippocampus,
c-Jun was detected in the dentate gyrus,
while phosphorylated c-Jun was not detected
in the rat hippocampus. Twelve hours after
the injection of KA or KA/CPT, c-Jun was
markedly induced throughout the hippocampus
(Figs. 5A and 5B). In contrast, c-Jun phosphorylation
was detected dominantly in CA3 pyramidal
neurons, and slightly in CA1 (Fig. 5C). When
CPT was injected 60 min before KA injection,
c-Jun phosphorylation was markedly induced
in the CA1 (Fig. 5D). c-Jun phosphorylation
was observed in some c-Jun-immunoreactive
pyramidal neurons in both the CA1 (Figs.
5E and 5F) and the CA3 (Figs. 5G and 5H).
Quantitatively, treatment with KA alone or
KA/CPT significantly increased the number
of c-Jun immunoreactive cells in the CA1
and the CA3 (Fig. 6A). Although phosphorylated
c-Jun was not detected in the CA1 or the
CA3, phosphorylated c-Jun significantly increased
after the injection of KA alone or KA/CPT
in both the CA1 and CA3 (Fig. 6B). The phosphorylation
of c-Jun in the CA3 was greater than that
in the CA1 after the injection of KA alone.
c-Jun phosphorylation was significantly enhanced
in the CA1 by the injection of KA/CPT in
comparison to that with KA alone.
Fig. 6: Photomicrographs of c-Jun and phosphorylated-c-Jun-
(P-c-Jun) immunostained sections in the hippocampus
12 hours after the injection of KA or the
combination of KA and CPT.
**Jump to the Top of Page, Fig. 1, Fig. 2, Fig. 3, Fig. 4, Fig. 5, Fig. 6, Fig. 7
Fig. 7: Quantitative analysis of the number of
c-Jun- and phosphorylated-c-Jun-immunoreactive
cells 12 hours after the injection of KA
with or without CPT.
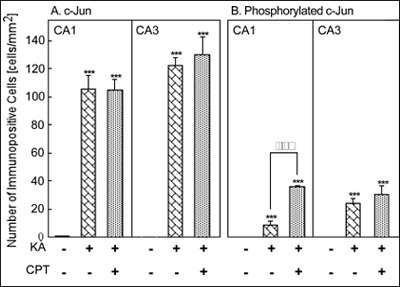
***P<0.001 versus vehicle injection, and
ü§ü§P<0.01 versus injection of KA alone
using ANOVA.
**Jump to the Top of Page, Fig. 1, Fig. 2, Fig. 3, Fig. 4, Fig. 5, Fig. 6, Fig. 7
<Top Page> <Introduction> <Methods> <Discussion> <Conclusion> <References>