Examination of the dimension on histopathology of skin diseases

Image processing of histopathological data
Figure 12

These images were automatically made, and the dimensions were
simultaneously calculated by the system ( View1 1.1 made by E Yagi)

Making of time series data (making of 700-2000 vectors )
1)Distance between cells
a. Cell interval is sought when the marker is arranged in concentric circular from the center of the image.
b. All combinations of distance between all 2 cells are sought, and the cell number that two cells enter in the limited interval divided with equal length is counted.
c. Cells are plotted with a certain width lengthwise, and arranged in order from near side. Distance of all pairs is measured.
2)Size of nucleus, A length / area of circumference, Concentration difference of nucleus
Value is put away in order of coordinate, and nucleus is extracted by order of 1).

Specimens to examine histopathologically
normal skin, seborrheic keratosis 6 cases, actinic keratosis 8 cases, Bowen's disease 6 cases, basal cell carcinoma 5 cases, squamous cell carcinoma 4 cases, Paget's disease 4 cases, dermatofibroma 3 cases, hemangioma 4 cases, pigmented nevus 6 cases

The time series data made from distance between cells ( left oblong figure).
The attractor made from time series data (right figure)
Figure 13

k=8, m=6, 6 dimension

Lyapunov exponent
normal skin: 0.21 (0.16-0.27), seborrheic keratosis: 0.18(0.07-0.28), actinic keratosis: 0.16(0.13-0.24) Bowen disease: 0.17(0.14-0.195) basal cell cancer: 0.2(0.15-0.26) squamous cell carcinoma: 0.22 (0.2-0.22) Paget disease: dermatofibroma: 0.15(0.06-0.25) hemangioma: 0.25(0.23-0.27) pigmented nevus: 0.22(0.17-0.27)

Mean of correlation dimension
Distance between cells Size of nucleus A length / area of circumference Concentration difference of nucleus
normal skin 6.1 3.31 6.0 5.92
seborrheic keratosis 5.1 4.3 5.82 5.34
actinic keratosis 5.0 2.61 6.4 4.2
Bowen disease 5.0 1.42 6.75 4.02
squamous cell carcinoma 4.9 0.85 7.87 6.15
basal cell cancer 5.2 1.35 6.67 1.74
Paget disease 4.6 2.65 7.4 3.1
dermatofibroma 4.84 2.6 7.68 6.88
hemangioma 3.6 2.22 6.8 7.9
pigmented nevus 6.05 3.0 6.16 6.2


Analysis of simple fractal dimension of the circumference in virtual tumor
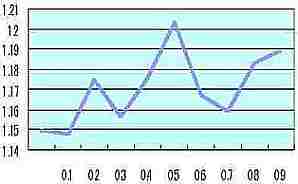
Simple fractal
dimension of
the circumference
in virtual tumor
Probability of the cell size change at one division of cell (0 to 0.9)

(This result was already presented Inabis98.)

In order to bring the character of virtual tumor close to the real tumor the coincidence of these dimensions is necessary. Coincidence within a small range may be possible, although a lot of computation process is necessary even in such accordance. If various kinds of algorithms (Genetic Algorithms, serious inquiry method etc.) are used and applied appropriately to choose the functions and coefficients, the examination of character with spreading of cells may be possible.